Sponsored Posts
How to Trade Double Tops And Double Bottoms With Up to 79% Winning Percentage
Published
7 years agoon

Many of my clients acknowledge that my FREE double top and bottom indicator is a very good indicator for intraday trading across various markets. This includes forex, stock indices, commodities and futures.
But there is a simple trick or a method that you can apply to greatly improve the performance of this Double Top/Bottom indicator. On average, my indicator currently gives a 57%-win rate. But using the methods I outline below, you can extend your wining rate of trades to as high as 79%.
This is no marketing hype but mere common sense and understanding of how the financial markets work. So, read on to know more.
As I explain this indicator, you will see why it can give you up to 79% winning trades using some simple methods.
But before we go into the details of how to use the double top/bottom indicator, I want you to understand the concept before you start using this great tool.
The reason is that, when you understand the concept that I teach, you can use this indicator to dramatically improve your trading performance. In fact, you do not need to stick to the four methods that I outline here.
You can very well experiment on your find and something that is unique to you and works for you to improve your trading.
Up to 79% winning trades with the Free Double Top/Bottom Indicator:
The double top and double bottom indicator is a simple yet robust trading indicator. It is available free of cost and you can download it to see how well it captures the double top and double bottom patterns in the market.
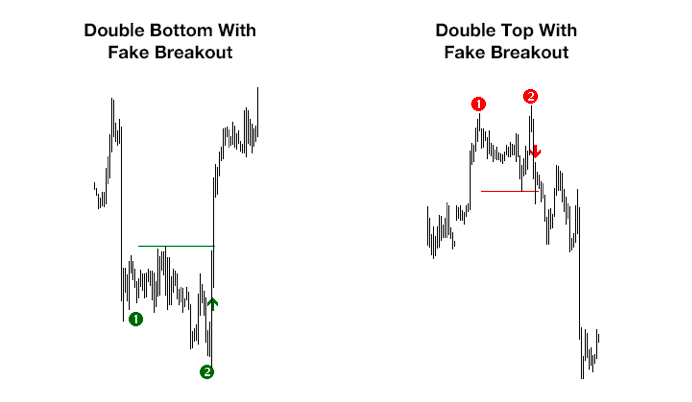
By just following my advice and reading below, you can improve your results by up to 22% with this indicator.
A simple way to understand what I’m about to teach you is by this example.
If you want to cross a street with heavy traffic and not get hit by a vehicle, then you need to be patient until you have a high probability to get to the other side safely. My trading concept is no different to this.
You already know how to cross the street. What I will teach you is when you should cross the street safely.
This is the same philosophy in my trading.
You should only trade those signals that give you a high probability of winning. In the rest of this article, you will learn how to do this.
The 1 + 1 = 3 Effect

Yes, 1 + 1 is not three. But in trading, you can have the effect of 1 + 1 = 3.
This is because when you combine two edges rather than one, your trading performance will simply skyrocket. This simple tweak can improve your risk-reward ratio tremendously.
Of course, you have to put in some effort on your end as well.
The 1+1 =3 effect is the very concept behind increasing your winning percentage to up to 79%.
In my Free Telegram group, I select only those double top and bottom signals from the M30 and H1 time frame if they have an edge. How do we find this edge, you ask?
We look to the bigger time frame such as the H4 and D1 which will enable use to edge to our advantage. We combine the larger and smaller time frame charts to get this envious edge in the market.
M30/H1 Signal + H4/D1 Edge = 3 Times Better Trading!
Yes! As you can see above, we use the larger time frame charts to give us the edge to trade from the smaller time frame chart. There are of course different signals that you can trade. This combination is what I will teach you on how to improve your winning performance.
A Mechanical Winning Percentage of 57%
If you are thinking where I got the above number from, then below is an explanation. It is not made up, but rather an enthusiastic member of my group stumbled upon this when researching the winning probability of the Double Top/Bottom indicator.
Recently, a member of my Telegram group analyzed 182 signals that were sent to the community during a span of the past 10 months.
The signal was based on the double top and bottom indicator which also gave an exact entry, target and stop price level. The risk or the distance between the entry and the stop loss level had a ratio of one. In other words, the risk/reward ratio was 1:1.
A profitable trade was identified as followed for the purpose of this analysis:
- If price moved from the entry price with at least one time the risk into profit, then this was a winning trade
- Thus, a risk/reward ratio of 1:1 was used in this analysis.
In the next screenshot, you can see the mechanical signals from the Free double top and bottom indicator. This produced 57% of winning trades out of 182 signals over 10 months.
The 57% of winning trades is already outstanding for a mechanical trading system. Most would agree!
A mechanical trading system can be compared to a set of rules for a blind and a deaf person who wants to cross the street. They can’t hear or see the street. They only walk to the other side.
A mechanical trading system is a type of a tool that will ensure that the blind and deaf person crosses the street safely simply by following the rules.
The next chart below is a screenshot from the analysis that was done.
The conclusion of the study was that the free double top and bottom indicator had a 57%-win ratio which reached the initial profit level which was the same as the risk.
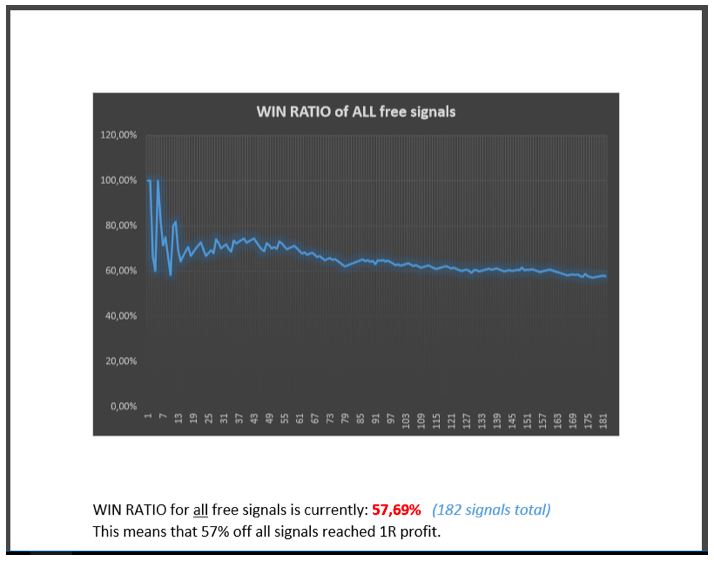
But you can greatly improve the win ratio by just using common sense 🙂
Increase your win rate to 79% with applied concepts
If you apply the concepts that I will teach you, then you can improve the win ratio from 57% to 79%. I will show you how you can use simple logic to achieve this. It is as simple as waiting for the traffic to allow you to cross the street.
The member of my Telegram group also conducted this analysis to see the improvement in the performance.
I will teach multiple strategies on how to select the best double top or bottom trading signals. By using this concept, the strategy quickly improved to 79%-win rate.
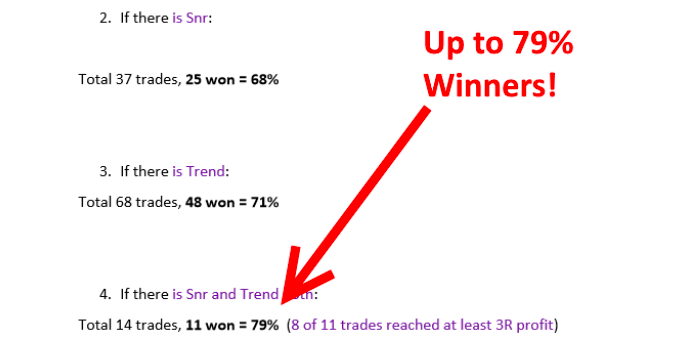
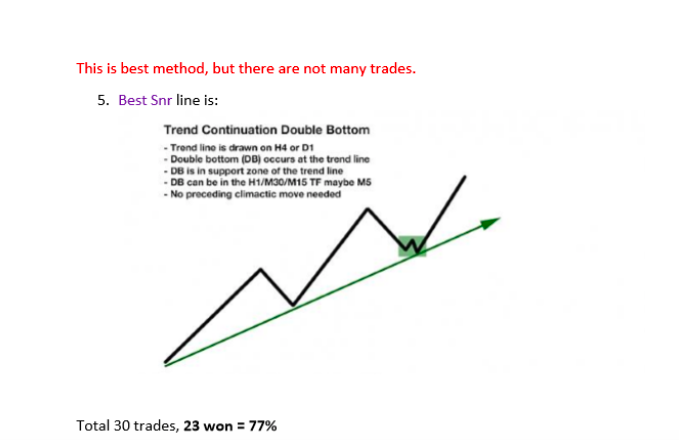
How is this performance increased possible? Read further! You can pick and choose from any of the concepts that I will explain below. It is best that you find one concept from the below which you are comfortable with and keep practicing it.
Strategies to select high probability trading signals!
Just like there are many ways to cross a street, I will also show you the different strategies you can use to trade only the high probability setups. I will explain these multiple strategies very briefly in this article, so you can get an understanding.
You do not have to use all the strategies mentioned. Just pick one that you line and you will automatically see an increase in your trading performance with a factor of 3!
Here are the strategies we use to get that winning edge:
Strategy #1: H4 Divergence for M30/H1 signals
Strategy #2: Trading signals directly at the trend line
Strategy #3: Trading signals when a trend line is broken
Strategy #4: M30/H1 Signals After Steeper Trend Lines
Strategy #1: H4 Divergence for M30/H1 signals
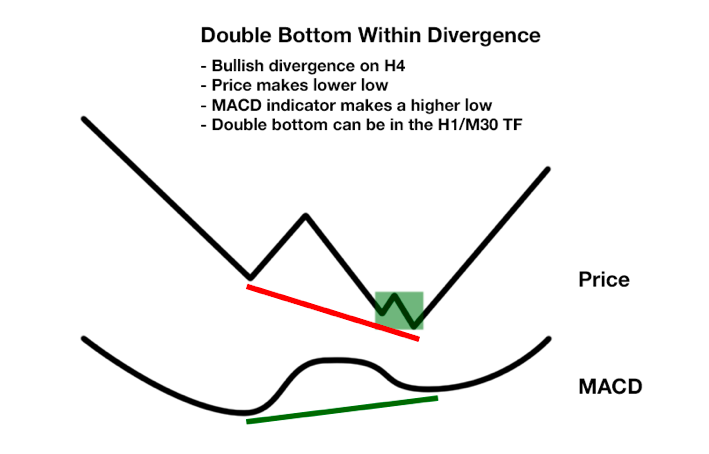
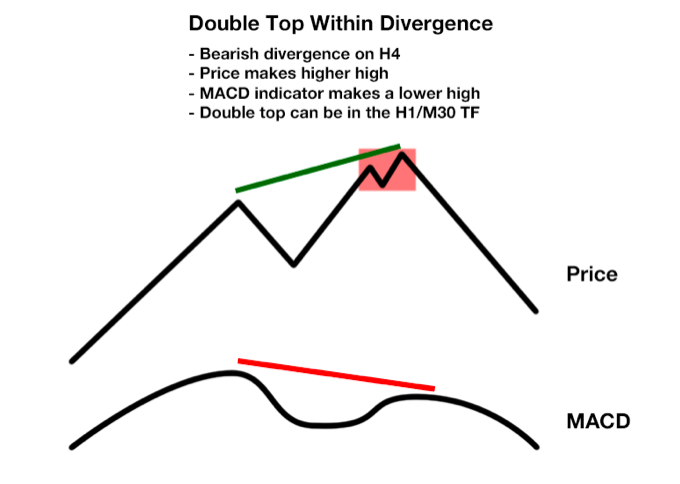
The first strategy is making use of divergence on the H4 chart to trade the double bottom and top pattern on the 30-minute or 1-hour chart.
The next screenshot gives an example of an effective trading set up. This is when a double top or a double bottom pattern is formed on the smaller time frame chart such as the M30 or H1 time frame.
We trade this pattern only when there is a MACD divergence on the H4 chart.
In the article, you will come across divergence analysis of over 34 instruments on the H4 time frame.
The screenshot shows how a double bottom can be traded within the bullish divergence of a MACD on the H4 chart. It is as simple as that!
The next chart shows a double top pattern that is formed within a bearish MACD divergence on the H4 chart.
Strategy #2: Trading signals directly at the trend line
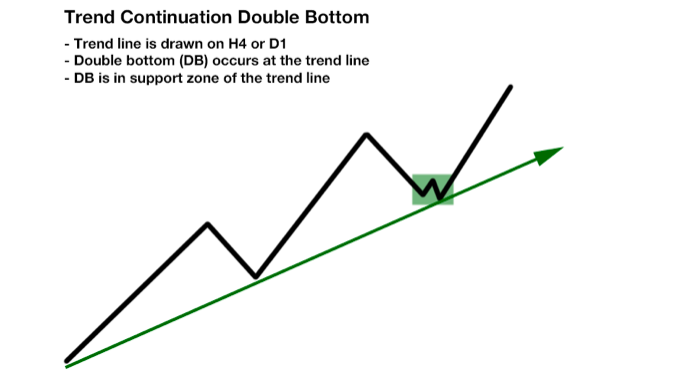
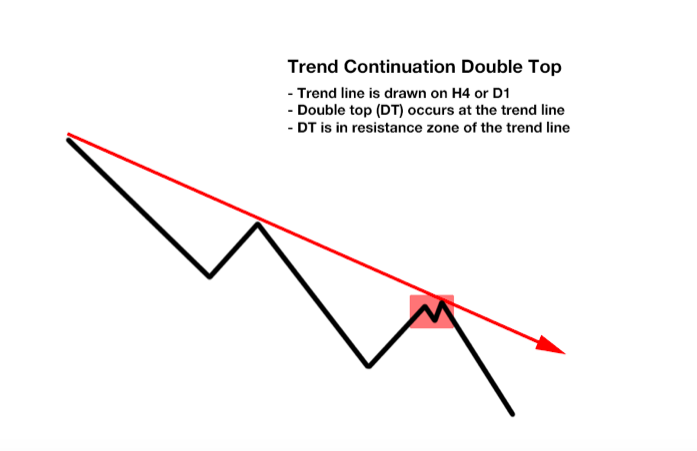
A trend line is probably the most important tool you can use to gauge the trend of an instrument. Double top and double bottom patterns that form directly at the trend line and in the direction of the trend can greatly improve your probability of winning trades.
This is because the trend from the larger time frame carries the price away from the entry point as you use the smaller time frame to pinpoint the trade entry with precision.
We start with drawing trend lines on the H4 or the D1 chart time frames. This becomes your major reference point.
The chart below illustrates a double bottom pattern that appears directly near the trend line.
The next screenshot below shows a bearish double top pattern formed near the falling trend line.
Strategy #3: Trading signals when a trend line is broken
The next strategy is using the trading signals when a trend line is broken. Finding a double top or a double bottom pattern after a trend is broken is a great way to picking successful or high probability trades.
Finding the double top and bottom pattern after a trend line break can be compared to a football that is held under water. You know that the football wants to pop up above the water line. It is the same case with this strategy.
You can expect price to rapidly rise after the double top or bottom is formed when a trend line is broken. Price action is quite volatile here and this set up can give big results very quickly.
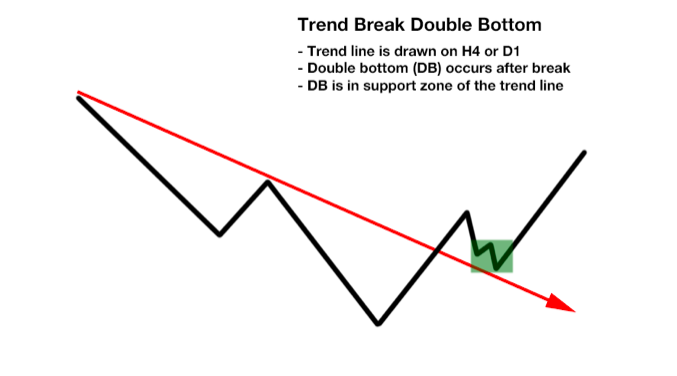
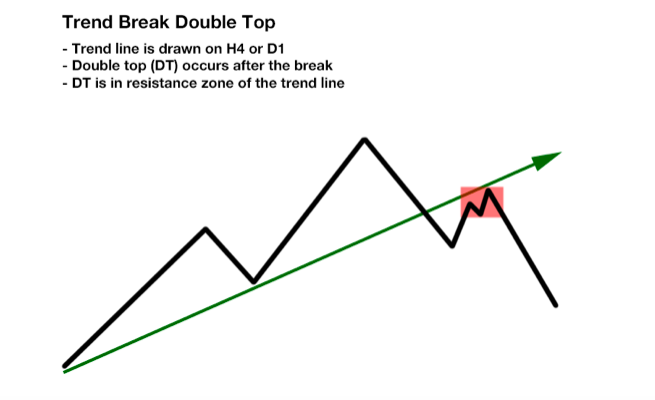
The screenshot above shows a double bottom pattern that is formed after a falling trend line broken. In the next screenshot below, you will see a double top pattern that is formed after a rising trend line is broken.
You can expect a big move once this pattern appears right after a major trend line break.
Strategy #4: M30/H1 Signals After Steeper Trend Lines
Trading with the steeper trend line set up is yet another way to capture the big move in price just before it happens.
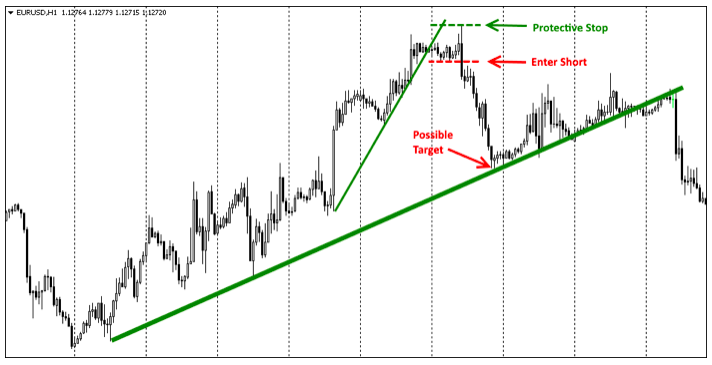
In this strategy, we look at two trend lines. The first trend line is a major trend line and is often sloped at a 45-degree angle. This is the major trend line that is respected and can potentially signal a trend reversal if it is breached.
The second trend line or the steeper trend line is smaller in scope. At the same time, this second trend line is steeper compared to the first trend line. The second trend line can slope to an extent of 60 degrees if not more.
Between the two trend lines, there is a significant space. This space is your profit potential. The entry of the double top pattern (between the two rising trend lines) or the double bottom pattern (between the two falling trend lines) is the trigger for the trade.
The following screenshot shows such a steeper trend line setup:
Also, my trading system V-Power (a day trading system for trading reversals) can highly benefit from such steeper trend line setups.
Conclusion:
As you can see from the above, the presented “1+1 = 3” effect is a great way to increase the performance of your trading. This effect is universal in the financial markets and is not just limited to forex or futures.
In fact, this effect is not bound to the signals of just the double top or the double bottom indicator. For example, you could also use my MagicEntry-system (a momentum trading system) which will give you the same desired effect when you use the bigger picture to your advantage.
Make use of the “1+1 = 3” effect and see the results with your own eyes.
This article was contributed by Mike Semlitsch, founder of PerfectTrendSystem.
Disclaimer: This is a sponsored post. Readers should do their own due diligence before taking any actions related to the company, product or service. BitcoinAfrica.io is not responsible, directly or indirectly, for any loss or damage caused by or in connection with the use of or reliance on any content, product or service mentioned in this paid sponsored post.
Sponsored Posts
Problems Nigerians Face With Bitcoin and Cryptocurrencies
Published
4 years agoon
May 31, 2022
Nigeria is ranked as Africa’s largest country with the most crypto traders and ranks third globally. The country accounts for the largest volume of cryptocurrency transactions outside the United States. In the last six months, it has been recorded that about 35% of the Nigerian population has traded cryptocurrency.
As encouraging as these numbers may be, Nigeria, as an environment, has been very unfriendly to cryptocurrency and its related aspects. Last year, the Central Bank of Nigeria ordered all commercial banks and lenders to stop transactions or operations in cryptocurrencies, citing a significant threat to the country’s financial system.
The ban on cryptocurrency in Nigeria was big negativity to the Nigerian youth, especially knowing that over 50 million of the population are involved in cryptocurrency. During this time, a lot of crypto trading platforms were shut down in the country. Also, many bank accounts suspected of dealing with cryptocurrency were locked, including their funds.
Even today (as of May 27, 2022), any bank transaction with a description or notes of “crypto,” “bitcoin,” “P2P,” or any crypto-related words will be locked away alongside the account(s).
The unfriendly treatment of cryptocurrency in the country is alarming. In the plight of making a positive solution, the community led to adopting systems where crypto traders could trade cryptocurrency without involving the bank.
Top 4 Problems Nigerians Face When Dealing with Cryptocurrency
-
Where to Buy or Sell Cryptocurrencies
Today, finding the right crypto trading platform that works for you significantly can be frustrating. Many cryptocurrency exchanges came into existence to aid in safer cryptocurrency transactions in the country. In this plight, some fraudulent platforms were made in disguise to exploit money from crypto investors. How would Nigerian crypto traders know which platform is genuine or not? With some checklists for selecting the best crypto exchange in Nigeria, you will be given key guidelines on how to choose the best place to sell bitcoin in Nigeria.
-
Speed of Transactions
A fast crypto transaction is important as the speed of cryptocurrency may block. Most times, transactions take hours to complete. Ideally, crypto transactions on regular crypto trading platforms take between 10 minutes to one hour. Surprisingly, some take over 5 hours. However, a few crypto transactions can take less than five minutes, depending on the app. In cases where we need transactions done quickly, or we accept crypto payments for your business, how do we intend to confirm payment before allowing customers to take their products? Should the customer wait for hours?
The speed of transactions has been a damaging factor for most Nigerian crypto traders. This has been a reason why many Nigerian companies find it difficult to accept cryptocurrency as payment options for their businesses.
-
High and Inconsistent Fees
Crypto transaction fees are another issue many Nigerians face. To really compare the best options for you, you have to look at the fees before and after conversion. What are the withdrawal fees, processing fees, and receiving fees,… These fees cause a huge discouragement in crypto trading in the country.
-
Limitations
It is saddening that many Nigerian crypto traders cannot make transactions because many of these crypto trading apps have put some limits on how much they can withdraw, receive, buy or sell. This breaches the purpose of cryptocurrency. Cryptocurrency has made it easy for people to send money from one place to another without a barrier. Why should I not be able to receive my funds because it is below your limit for withdrawal?
Limitations have made many Nigerians lose interest in cryptocurrency or lose their cryptos.
These factors, alongside many others, have caused the trading of cryptocurrency in Nigeria very difficult.
How Breet Solves Some of the Issues Nigerians Face in Cryptocurrency
Breet is an OTC crypto exchange platform that allows users and businesses who simply want to receive crypto and get a flat equivalent of their coin to convert their crypto to cash money immediately.

With Breet’s over-the-counter system, you are saved from the hassle of boring explanations of what and how crypto works and tedious illustrations of cryptocurrency market charts. Breet enables users to securely convert and withdraw their crypto coin to cash money in less than five(5) minutes without the use of peer-to-peer trading or any third-party agent.
Breet is a revolutionary new way to convert and withdraw your crypto coin without the need for peer-to-peer trading or any third-party agent. With just one click, you can have cash money in hand within five minutes.
With Breet, you can sell your cryptocurrency in less than 5 minutes. This is an incredible feature on its own, meaning businesses can now accept cryptocurrencies as payment options without having their customers wait for hours to confirm payment.
Breet is also completely free. There are no hidden charges, no withdrawal fees, no processing fees and no receiving fees. There are zero charges with Breet. Breet’s free usage solves the issue of high and inconsistent charges for many Nigerian crypto traders.
There is no limitation to how much you can receive or withdraw on Breet. You don’t have to have about 10,000 Naira worth of cryptocurrency before you can withdraw. You can even withdraw as low as 100 Naira with Breet Exchange.
Breet is simple, free and certified. There is not much sugar coating to tell before believing that Breet is, arguably, the best crypto trading platform in Nigeria currently. The incredible reviews on the Breet app give perfect evidence.
What more do you need? If not, a crypto exchange that makes crypto transactions easy and makes people happy. You should become a Breet user by downloading Breet mobile app available on all Android and iPhone devices.
Remember being a crypto trader in Nigeria can be challenging. This is why it is important for you to learn more about cryptocurrency and the latest news by doing your own research.

The much-anticipated transition of the Ethereum network from proof-of-work (PoW) to proof-of-stake (PoS) consensus is finally taking place. The adaptation of PoS has always been the plan and a vital part of scaling Ethereum by future upgrades. However, abruptly shifting to PoS can pose significant technical and community challenges that are not as simple as using PoW to achieve network consensus. Having said that, what exactly are PoS and PoW?
Proof of Work
Proof-of-work (PoW) is a consensus algorithm that allows for the secure, decentralised verification of transactions on a blockchain. In a PoW system, miners are responsible for verifying and committing transactions to the blockchain. During the verification process, miners compete against each other to solve complex cryptographic puzzles. The first miner to solve the puzzle is rewarded with cryptocurrency, and the transaction is added to the blockchain.
Reasons To Shift From Proof of Work
The Ethereum ecosystem has evolved at an astounding rate in the last year. This growth was primarily due to a significant emergence and explosion of NFTs and Decentralised Finance (DeFi) initiatives. While the change-over was imminent, some factors to be considered for the same are:
- The PoW consensus protocol requires users to utilise significant computational power to validate transactions and add new blocks to the network.
- Users who devote their computational resources to the shared ledger are miners.
- These miners are rewarded with Ether tokens in exchange for the computing power they have supplied to the network.
- With PoW consensus, Ethereum takes up to 113 terawatt-hours of electricity in a year. According to Digiconomist, it is more than the total electricity consumption of the Netherlands per year.
- The current Ethereum transaction with PoW consensus takes up energy equivalent to the consumption of one week of energy of an average US household.
With so many downsides to its cap, PoW has many advantages, which is one of the main reasons it has been a reliable consensus for so long. The PoW consensus has been robust and secure all these years. But the consensus can be utilised by a cryptocurrency with a massive valuation and relatively simple use case, such as the bitcoin. With the amount of energy and power involved, it becomes difficult for individuals to meddle with a high valuation asset.
Proof of Stake
The consensus protocol Proof-of-stake (PoS) has been introduced to address the issue of over-mining. Proof of stake (PoS) is critical to understand because it could eventually replace the proof of work (PoW) consensus mechanism that is currently used by most cryptocurrencies.
“PoS is a way to achieve decentralised consensus without using energy-intensive mining. It is an alternative to the more common proof of work algorithm. With PoS, a cryptocurrency’s blockchain is secured by its token holders who are required to lock up their tokens as stake and not by miners equipped with powerful hardware. It’s an energy-efficient, cost-effective and therefore, a popular choice for crypto giants like Ethereum,” states Dev Sharma, CEO of Blockwiz, a crypto marketing agency.
In contrast to PoW, in which the individual who completes the mathematical proof first is rewarded with new coins, with PoS, no new coins are created.
Benefits of Proof of Stake Consensus
Proof-of-stake introduces several enhancements over the PoS mechanism:
- Improved resource proficiency – you don’t need as many energy mining blocks.
- Minimal entry barriers, lower hardware requirements – Even if you don’t possess top-tier hardware, you still get ample opportunities to participate in the creation of blocks.
- More excellent resistance to centralization – PoS would imminently facilitate the generation of more nodes.
- Staking facilitates the operation of a node. It does not necessitate significant expenditure on equipment purchases or resources, and if you lack the ETH token to stake, you cannot participate in staking pools.
- Staking consensus enables reliable sharding. Shards enable Ethereum to generate new blocks simultaneously, leading to enhanced throughput of transactions.
- In a PoW mechanism, sharding the chain would reduce the amount of energy required to modify a particular network section.
In a Nutshell
Proof of stake (PoS) is a type of algorithm used by cryptocurrencies to determine who gets to create new blocks on the blockchain. PoS works by requiring users to lock up some of their currency in a smart contract called a stake. In return, they are given the right to validate blocks on the network and earn rewards.
The advantage of PoS is that it doesn’t require the massive energy consumption that PoW does. This non-dependency on massive energy utilisation makes it more environmentally friendly. It reduces the risk of centralisation since few users would be able to control the majority of the currency. Therefore, it’s no wonder that Ethereum is making the much-anticipated switch.
Sponsored Posts
Amber Group March Recap 2022: Here’s What Happened
Published
4 years agoon
April 14, 2022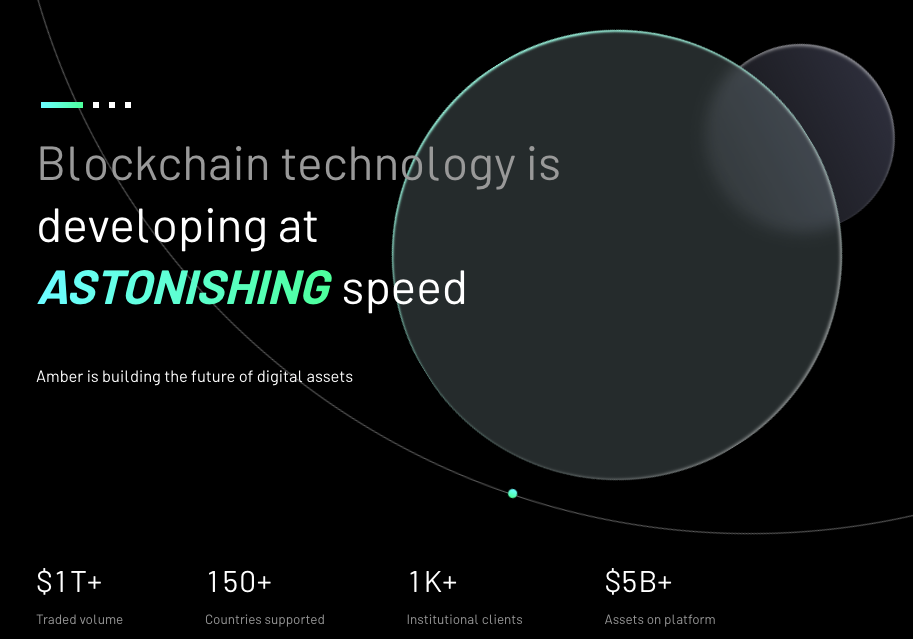
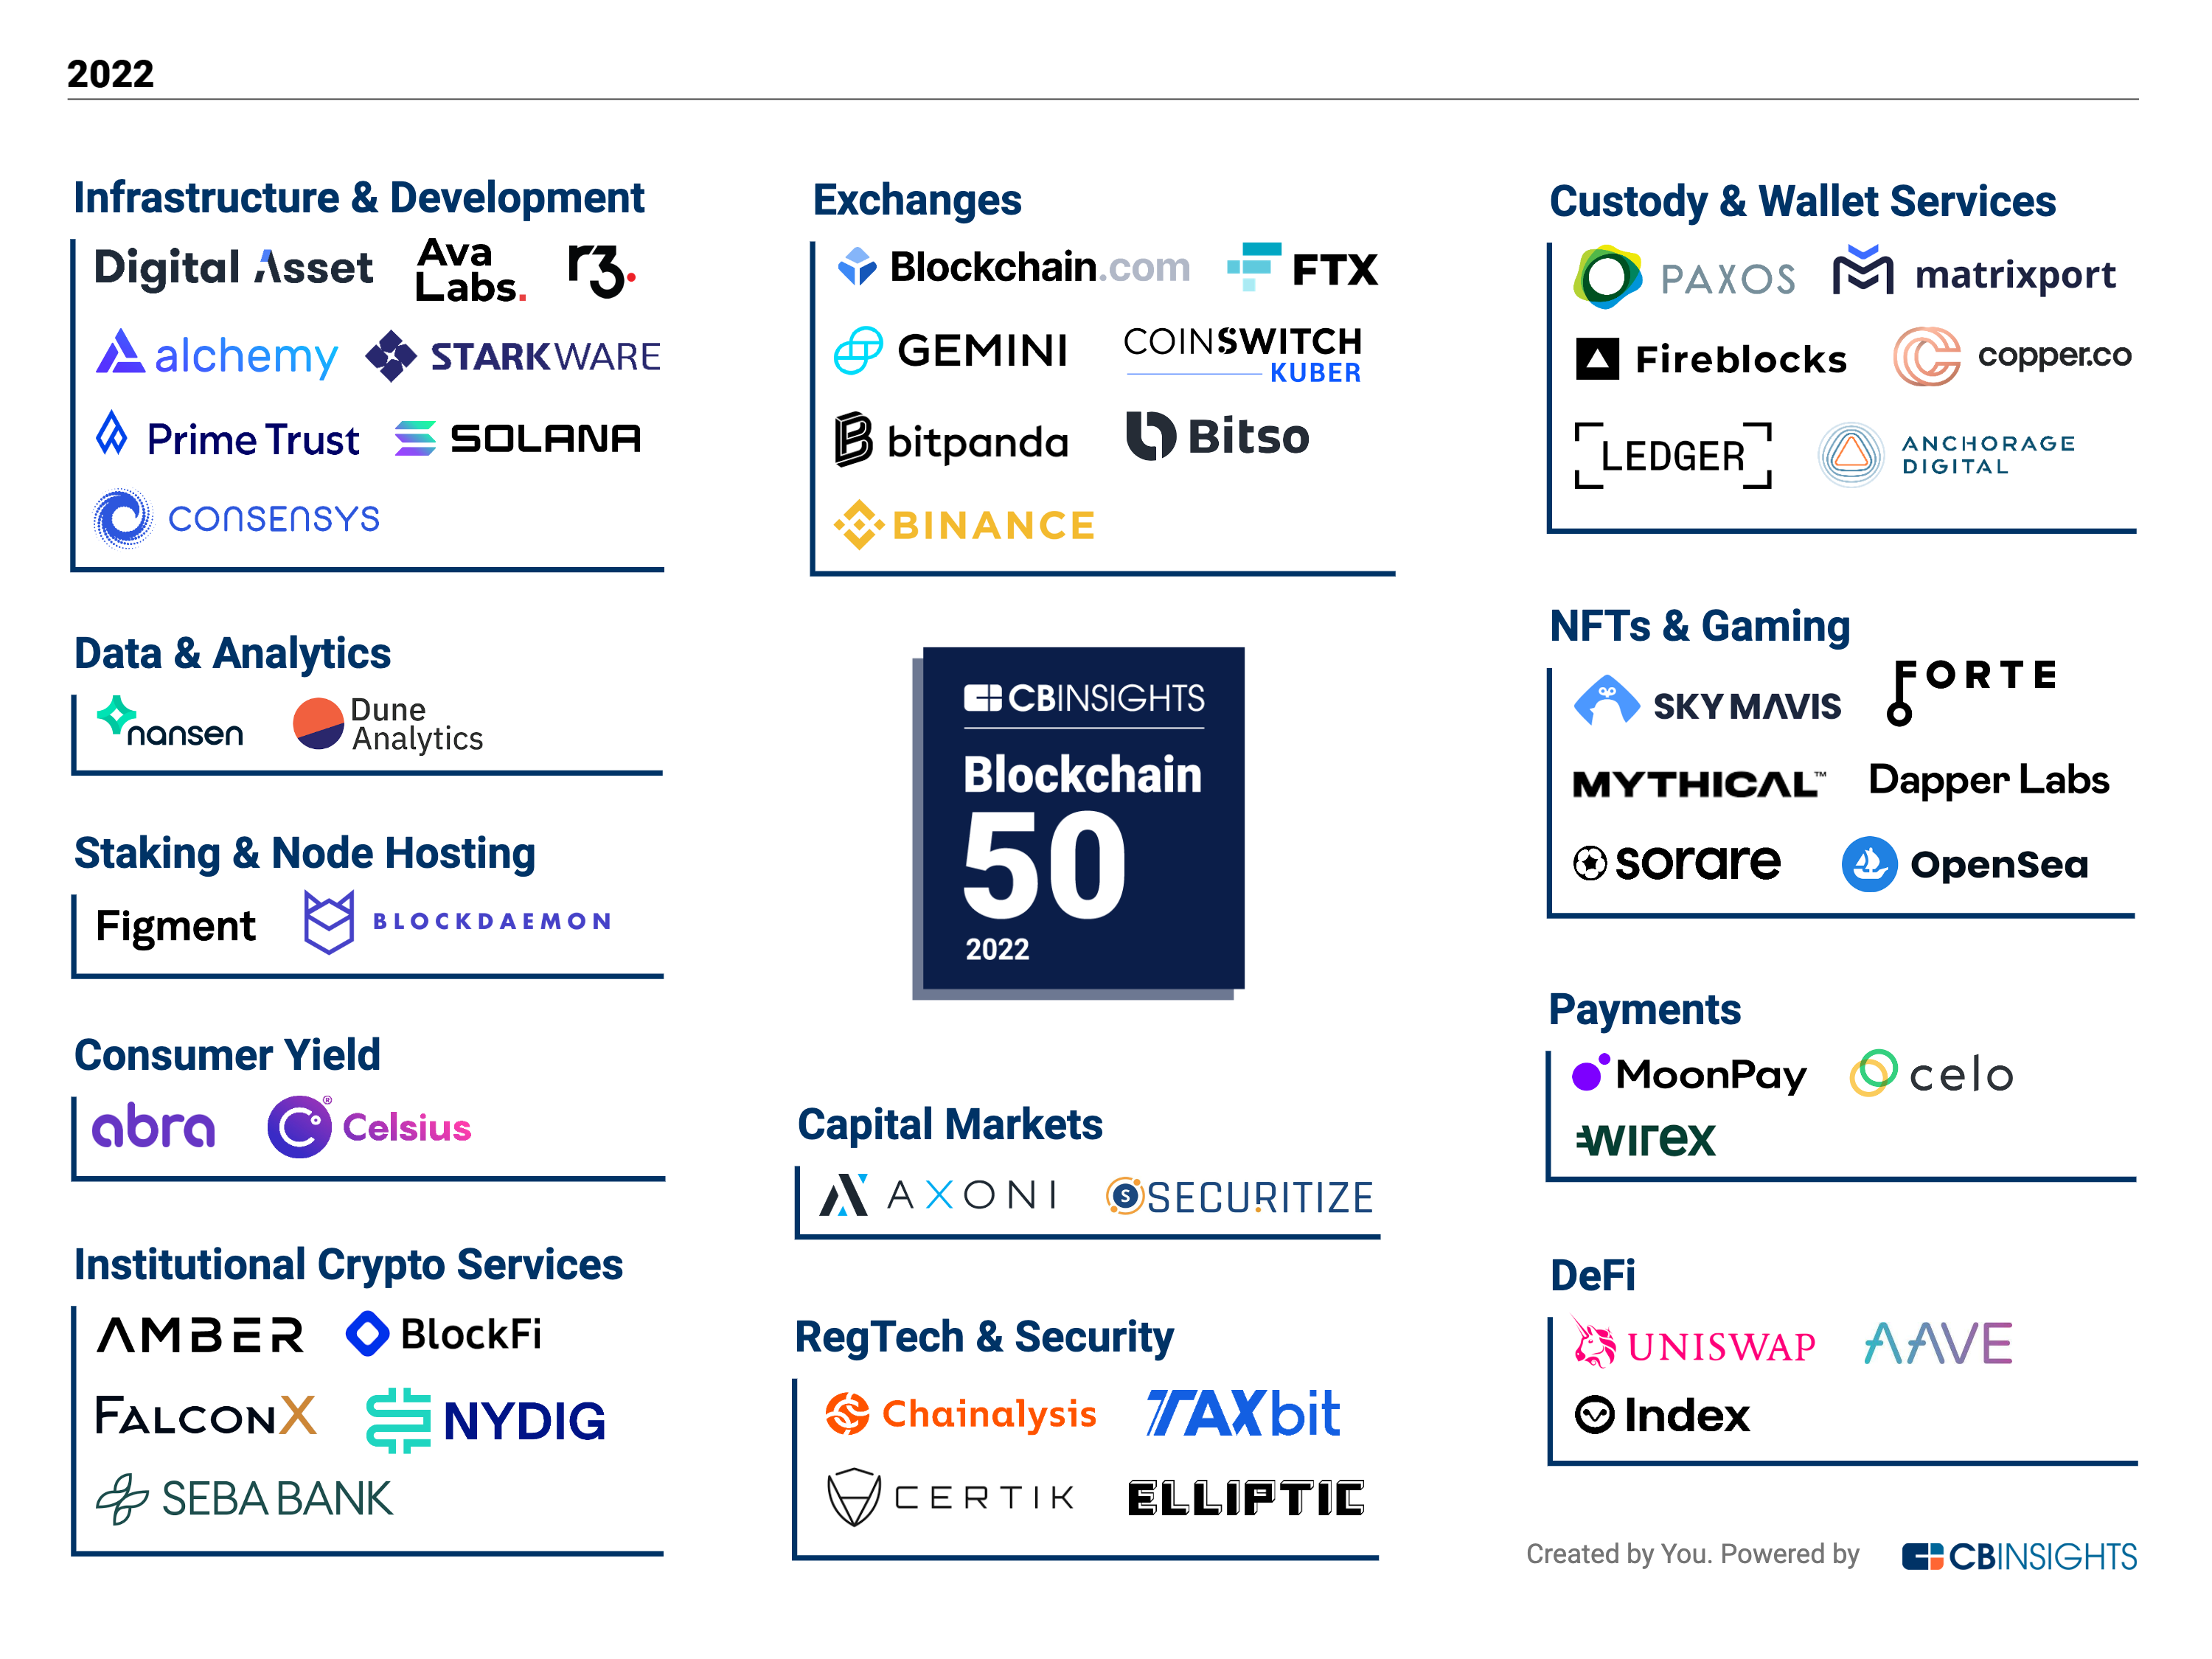 Named one of CB Insights’ 2022 Blockchain 50, an annual ranking of the most promising blockchain and crypto companies in the world.
Announced the appointment of Ehsan Haque as the General Counsel for Europe, Middle East, and Africa (EMEA) region.
CEO Michael Wu was selected as a recipient of the “Top 100 CEOs in Innovation Award 2022” by Word Biz Magazine.
Product Development and Partnerships

Participated in Mina Foundation’s token sale, EthSign’s seed round, and Zecrey protocol’s angel round.
In the News

World Biz Magazine: Michael Wu, CEO of Amber Group – interview WBM Top 100 Innovation CEO.
CNBC: For crypto to be adopted globally, we will have to comply with regulators: Crypto-trading platform.
Bloomberg: Bankers Who Stay in Hong Kong Are Rewarded With a Pay Bonanza.
Economist: EthSign raises $12 million in stable coin led by Sequoia Capital India, Mirana Ventures.
Forkast News: From crisis currency to consumer adoption: What next for crypto?
CoinDesk: Mina foundation raises $92M to accelerate adoption of Zero-Knowledge Proofs.
Cointelegraph: If the glass slipper doesn’t fit, smash it: Unraveling the myth of gender equality in crypto.
AMBCrypto: Amber Group strengthens management team with Ehsan Haque as EMEA General Counsel.
CoinCu: Zecrey protocol has raised $4M in an angel fundraising round.
Chain Debrief: Is the user experience in DeFi bad? Opportunities, challenges and how to see growth in DeFi.
Medium: Reproducing the $APE airdrop flash loan arbitrage/exploit.
Medium: Non-fungible trends.
Events and Media Appearances

CEO Michael Wu joined Forkast News to discuss crypto’s consumer adoption and what’s next for crypto.
CEO Michael Wu joined CNBC Street Signs Asia to share how Amber Group seeks a balance between regulation and crypto development.
CEO Michael Wu gave an interview with Economist Impact at Technology for Change Week on how to stay ahead of the curve in the fintech space.
Managing Partner Annabelle Huang joined Economist Impact’s Asia Trade Week to discuss the future of crypto as payment in Asia.
Managing Partner Annabelle Huang joined Avalanche Summit to discuss the opportunities and challenges in DeFi.
Managing Partner Annabelle Huang joined Goldman Sach’s panel discussion on “Digital assets – Investing in the future” to celebrate International Women’s Day.

Managing Partner Annabelle Huang gave a guest lecture on DeFi and Web3 for the International Finance class at Singapore Management University.
Managing Partner Annabelle Huang joined the DIG FIN VOX podcast to talk about Amber Group’s move to Singapore and into retail.
CSO Dimitrios Kavvathas joined Blockchain Africa Conference 2022 to discuss institutional investment in crypto.
CSO Dimitrios Kavvathas joined FinTech Festival India at a panel discussion on “De-Fi – A better solution for peer-to-peer lending”.
CSO Dimitrios Kavvathas joined the World Blockchain Summit in Dubai at a panel discussion on “Fostering the global crypto ecosystem”.

Europe Managing Director Sophia Shluger delivered a keynote speech on digital wealth at Blockchain Africa Conference 2022.
Europe Managing Director Sophia Shluger joined the CryptoCompare Summit in London to discuss the building blocks of the new digital economy.
Europe Managing Director Sophia Shluger joined the FundFocus Europe 2022 conference to discuss the foundation for the widespread institutional adoption of cryptocurrency.
 Rear
Rear
Latin America Managing Director Nicole Pabello joined the Ethereum Rio conference to discuss the LATAM Ecosystem in the world.

Institutional Sales Director Justin d’Anethan joined EmergentX’s Annual Digital Asset Summit to discuss the institutionalizing of the digital asset industry.

Managing Director Ben Radclyffe joined Credit Suisse’s Asian Investment Conference to discuss the spillovers between crypto and equity markets.

Magic Eden Has Quietly Become the Best Ethereum NFT Marketplace

Samara Asset Group Launches Bitcoin CPI (BTCCPI)

Introducing Noones – Africa’s P2P Super App

Why Crypto’s Leading the Way in Africa’s Evolving Finance Landscape

The Rise of Bitcoin in the Online Gaming World

Unlock the Thrills of NHL Crypto Betting and Live Streaming

Understanding the Impact of Cryptocurrency Volatility on NBA Betting Markets

The Future of Crypto College Football Betting: Trends and Predictions

How Mobile Apps are Changing Sports Betting

Weekly Roundup: Africa’s Cassava Network Partners with UniPass to Expand Crypto Adoption in Africa & More
Popular Posts
-

 Features3 years ago
Why Crypto’s Leading the Way in Africa’s Evolving Finance Landscape
-

 Bitcoin2 years ago
Introducing Noones – Africa’s P2P Super App
-

 Features3 years ago
The Rise of Bitcoin in the Online Gaming World
-

 Features3 years ago
The Future of Crypto College Football Betting: Trends and Predictions
-

 Features3 years ago
Understanding the Impact of Cryptocurrency Volatility on NBA Betting Markets
-

 Features3 years ago
Unlock the Thrills of NHL Crypto Betting and Live Streaming
-

 Features8 months ago
Magic Eden Has Quietly Become the Best Ethereum NFT Marketplace
-

 Bitcoin10 months ago
Samara Asset Group Launches Bitcoin CPI (BTCCPI)


